
PTE口语满90之DescribeImage
实例

题目要求:
考生有25秒时间去看某种图(饼、表、柱、线、流、程、地),然后连续说40秒。由于语速需要是native speaker的语速,所以学生需要练习自己的流利度。连续三秒学生不说话,就会进入下一题。
考查能力
A .读图能力
B .语言表达
C .中高语速
失分原因
A. 读图顺序混乱
B. 企图抓住每个细节,忽略要点,即得分点。
C. 过分纠结于语言完美,影响了流利度。
D. 语速过慢,规定的时间(40秒)说不完。
应对策略
A.遵循读题三部曲:1 标题。2 图例。3 纵横坐标起始点。
B.谨记得分关键点:(线图为例:五点合一,起点,终点,交点,最高点,最低点。)
C.目标65的考生,忽略语言多样性,注意精准就可以。
D.强化练习,不同图形下形成自己独特的常用句式结构,不加思索,脱口而出。
实例讲解:
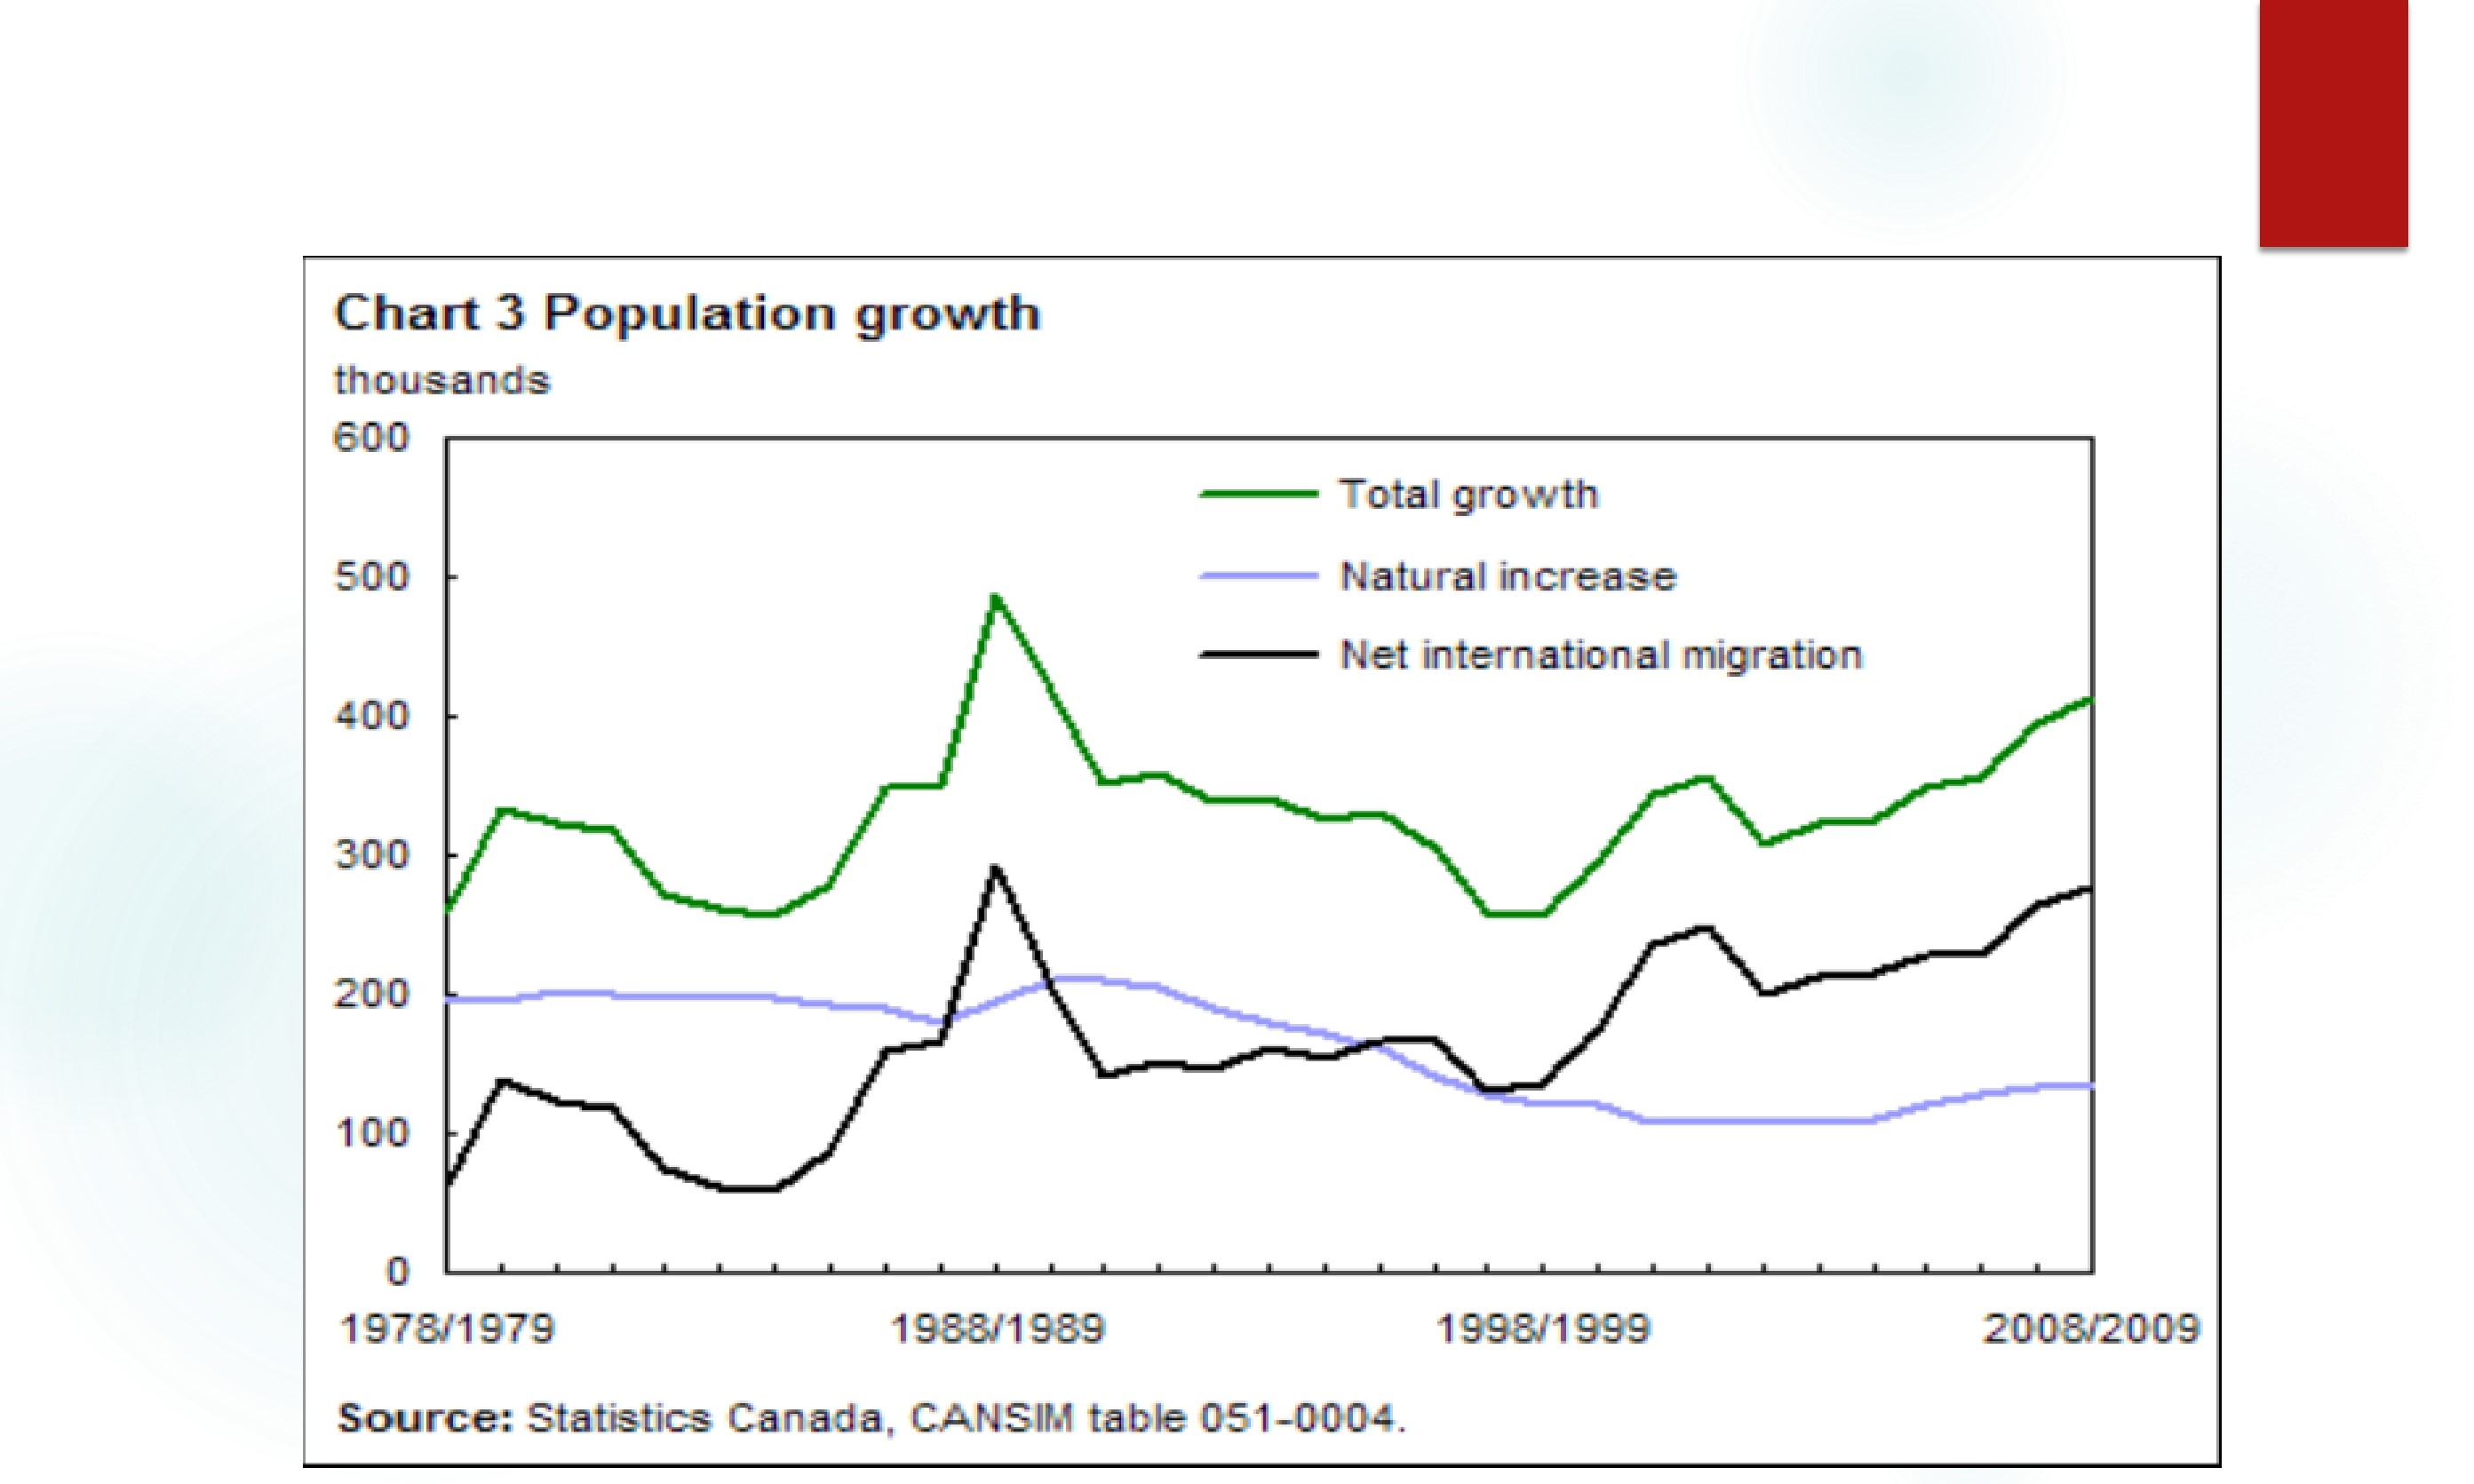
This graph shows the growth of the population in Canada from 1978 to 2009.It is taken from the website about statistics in Canada(overview)
There are three graphs in the chart. The green graph shows the total growth of the population, the black one deals with the migrants in Canada and the blue graph shows the natural increase of the population.(Point 1)
In 1988/1989, there was an enormous growth. In the following years the total growth went down to about 250,000 in 1998/1999 (Point 2)
From that time on the Canadian population has been gradually growing again although the natural increases slows down.(Point 3)
So we can say that the growth of the population in Canadians based on migration.(Conclusion)